

The Icelandic residential market – Where do we go from here?
Sölvi Blöndal, Head of Economic research at GAMMA Capital Management carried out a status check of the Icelandic real estate market
Key findings: The increase in Icelandic housing prices from 2012 - 2016 mainly reflects demand and supply factors in the market - demographics and population growth, increase in tourism, scarcity of land, steady growth in purchasing power and improvement in expectations. Easy credit or irrational exuberance in the market seem to have played a limited role. We expect the housing market to continue along an upward trajectory in 2017 with prices increasing by 14-16% in Reykjavik and vicinity. Demand will grow, supported by demographic factors and a continued increase in the purchasing power. Supply will remain limited in 2017 but is expected to pick up in 2018. Indicators to watch in the coming months include the price-to-wages and rent ratios, both of which have been trending upwards. A further increase could signal an unsustainable trajectory in the medium to long run. The cost of borrowing has also been on a downward trajectory, a trend that is expected to continue this year. In the current environment of scarce supply and rising demand, an easing of the credit evaluation or LTV would be a game changer directly impacting asset value. Therefore, the housing market is facing two distinct risk factors: (i) a domestic shocks, with a price increase in excess of what fundamentals warrant, causing inflation and a consequent reaction from the monetary authority, leading to less supply of credit etc; or alternatively (ii) a sudden external demand shock (i.e., due to slow down in tourist arrivals), with a consequent collapse in expectations and less supply of credit.
2016 stronger than expected
The Icelandic (Reykjavik and vicinity) residential market performed much better in 2016 than predicted. Most analysts forecasted about 7-9% increase in residential real estate prices last year. However, prices increased by 15% in 2016, 12.8% inflation adjusted (see diagram 1), in Reykjavik and vicinity, 27.5% in USD and 29.9% in EUR (see diagram 12). This development was supported by strong demand and a lack of supply of new housing due to municipalities' limited zoning of new areas for construction.
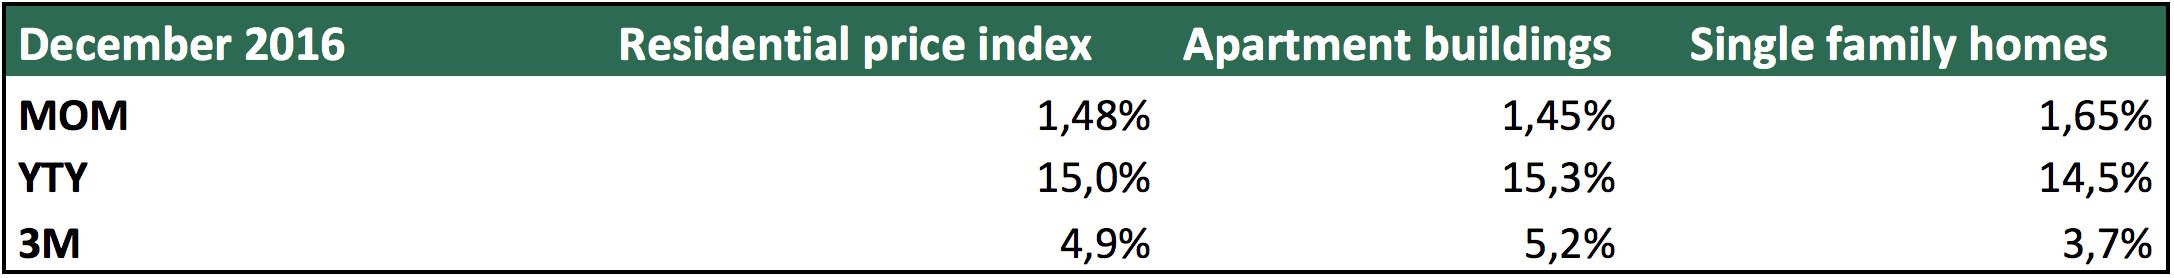 Diagram 1
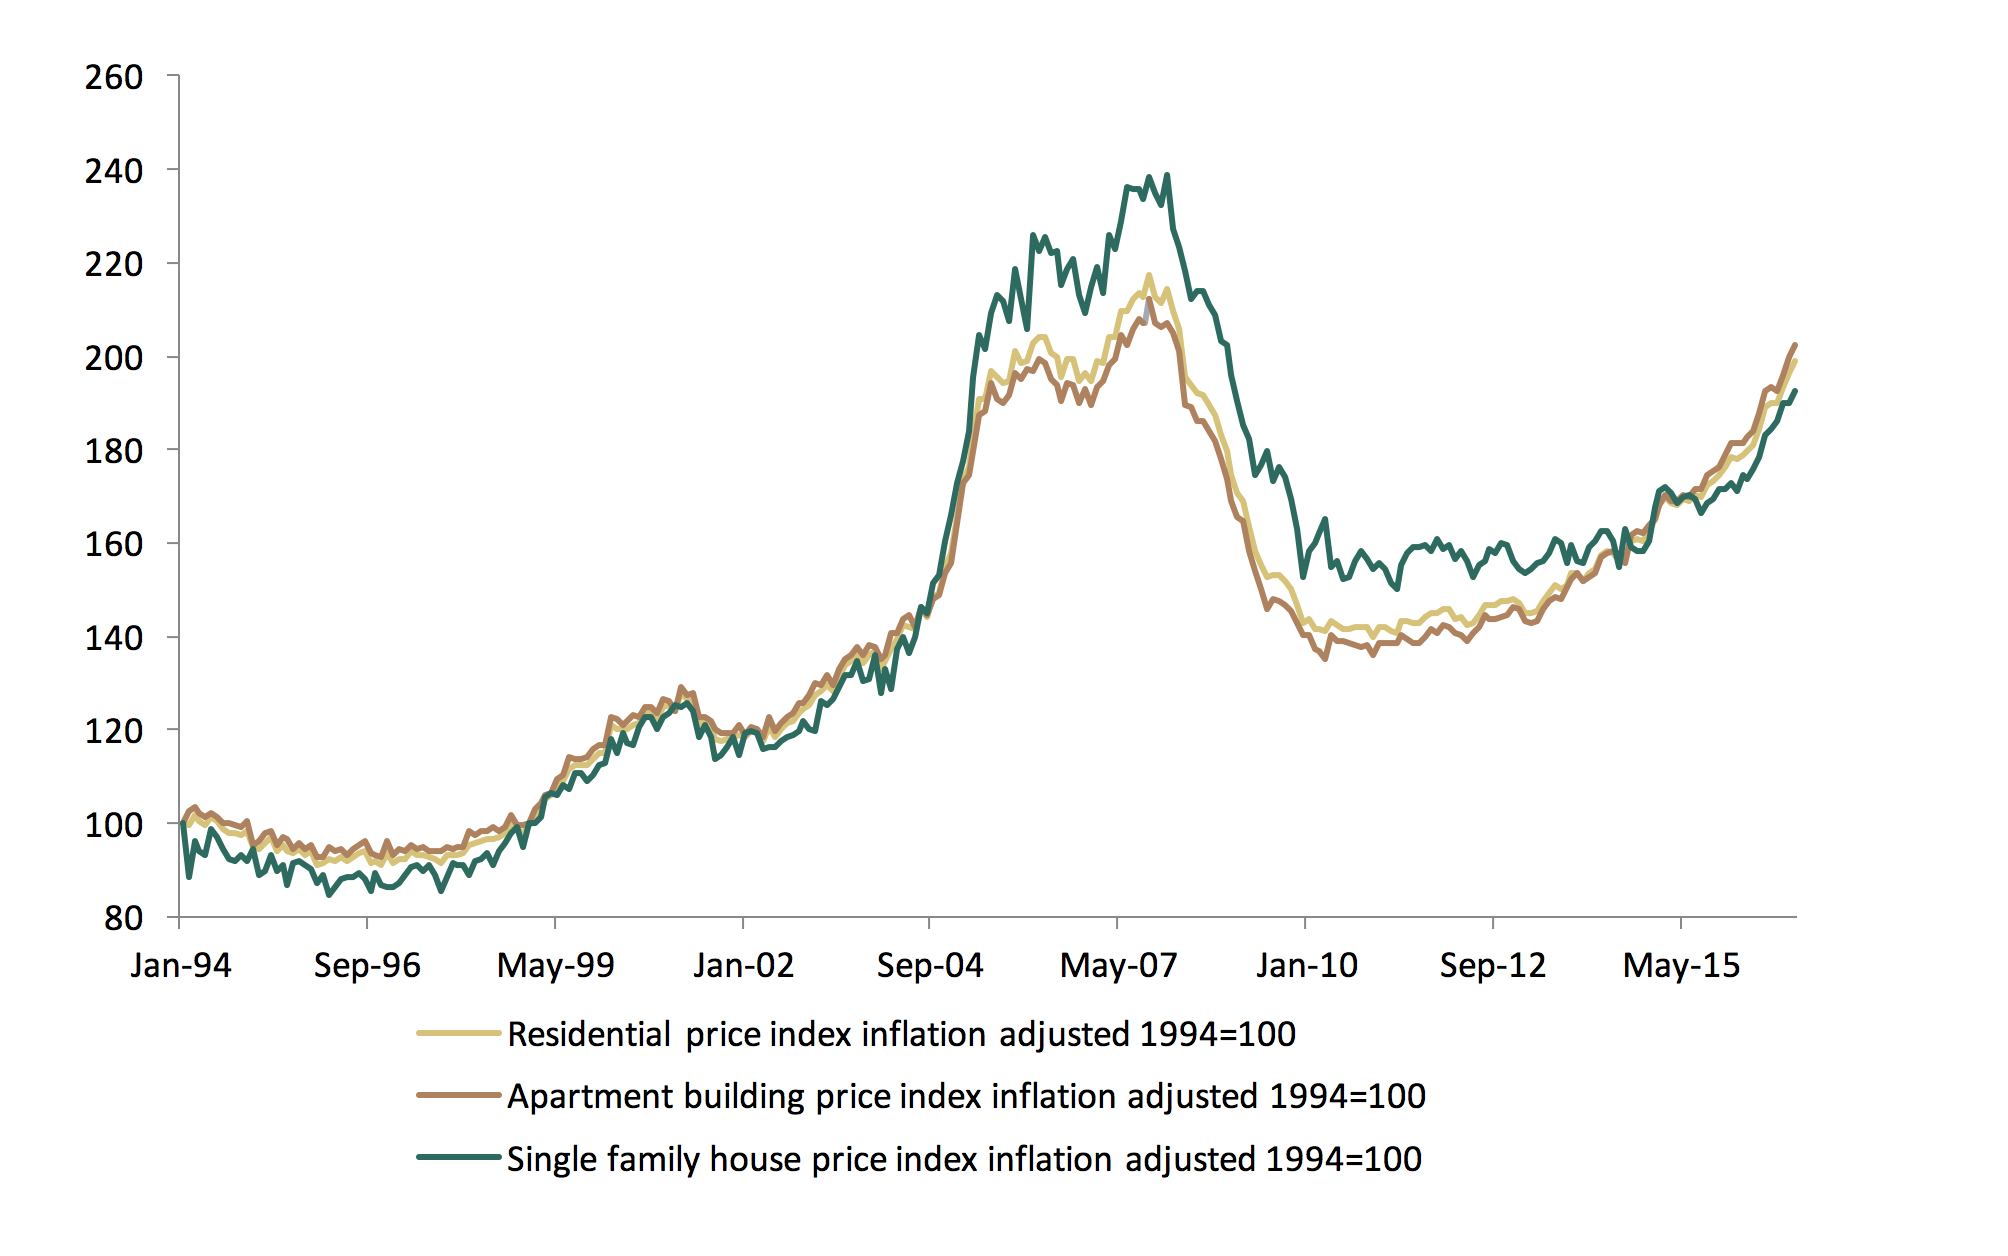
Source: Registers Iceland
Residential price increase supported by fundamentals
Inflation-adjusted residential prices have increased by 32% since 2011 awhile aggregate demand increased by 24%. The correction of residential housing prices (inflation adjusted) after the burst of the credit bubble in 2008, followed by the largest deleveraging in recorded history has likely come to an end. New loans to residential buyers continued to increase albeit at a slow pace (see diagram 2) due to stricter LTV rules and credit evaluation, than in the period 2004-2007. The public´s appetite for leverage also seems to have decreased despite the cost of borrowing being at an all time low. Overall leverage has been decreasing with household debt standing at 81% of GDP compared to 128% of GDP in 2008 and household debt with collateral in residential housing standing at 35% in 2016 compared to 58% in 2011. In the current environment of underleverage, scarce supply, and rising demand, an easing of credit evaluation or LTV rules would be a game changer for asset value.
Diagram 2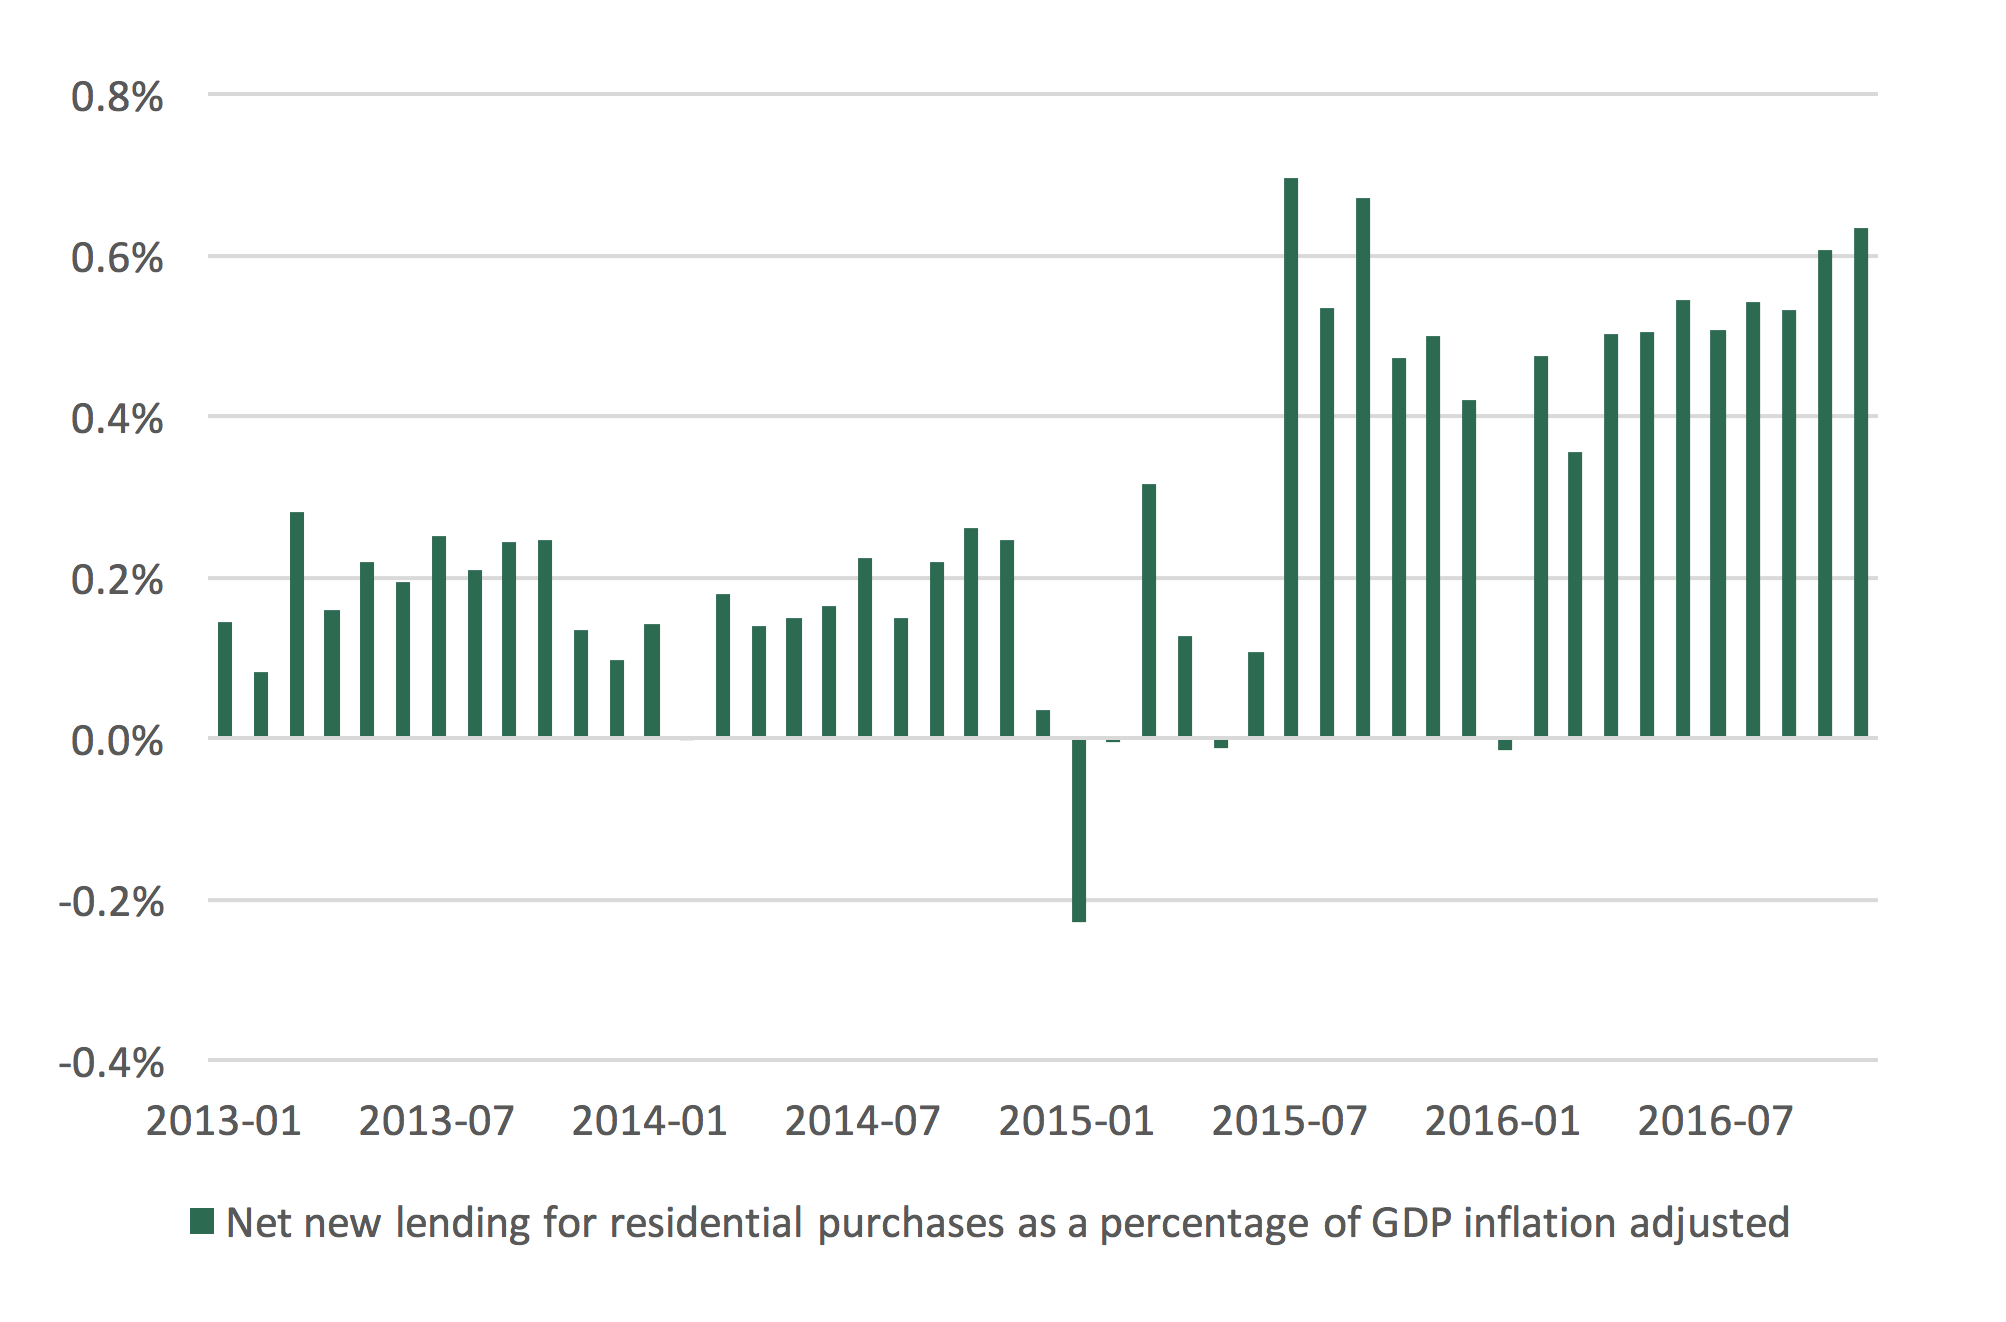
Source: Central Bank of Iceland
What is driving demand?
Household purchasing power increased by 10% in 2015 and 7% in 2016 respectively, i.e., the biggest increase for more than 30 years. This and the consequent improvement in expectations (see diagram 4) have translated into a considerable increase in housing demand which has reached its highest volume since 2007 in Q4 2016 (see diagram 7). The household purchasing power is expected to grow by 6.7% this year followed by a 4.5% increase in 2018, further supporting housing demand.
Diagram 3
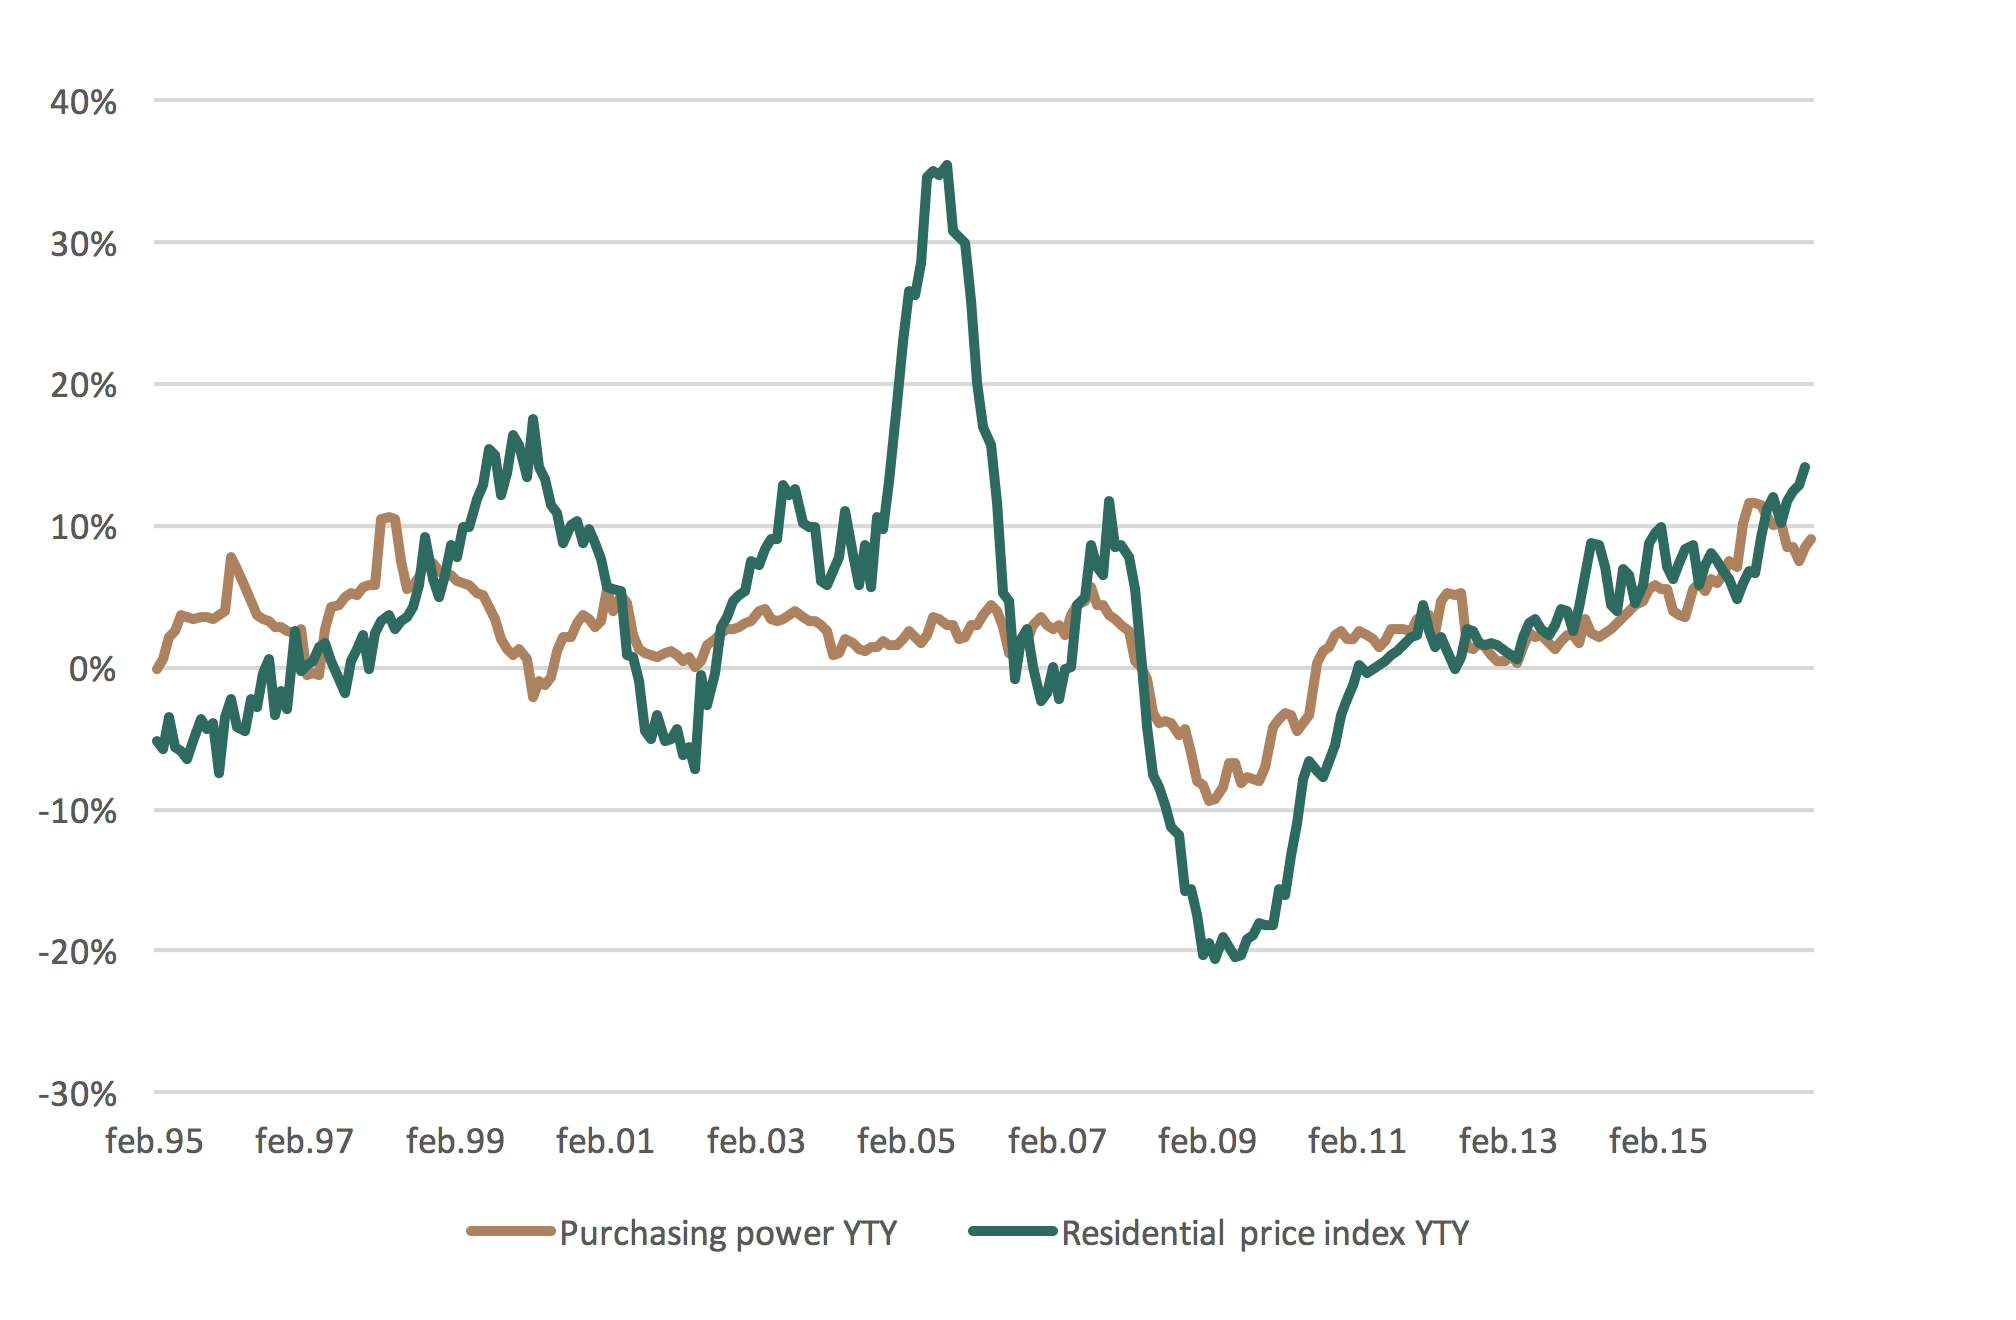
Source: Central Bank of Iceland, Registers Iceland
Diagram 4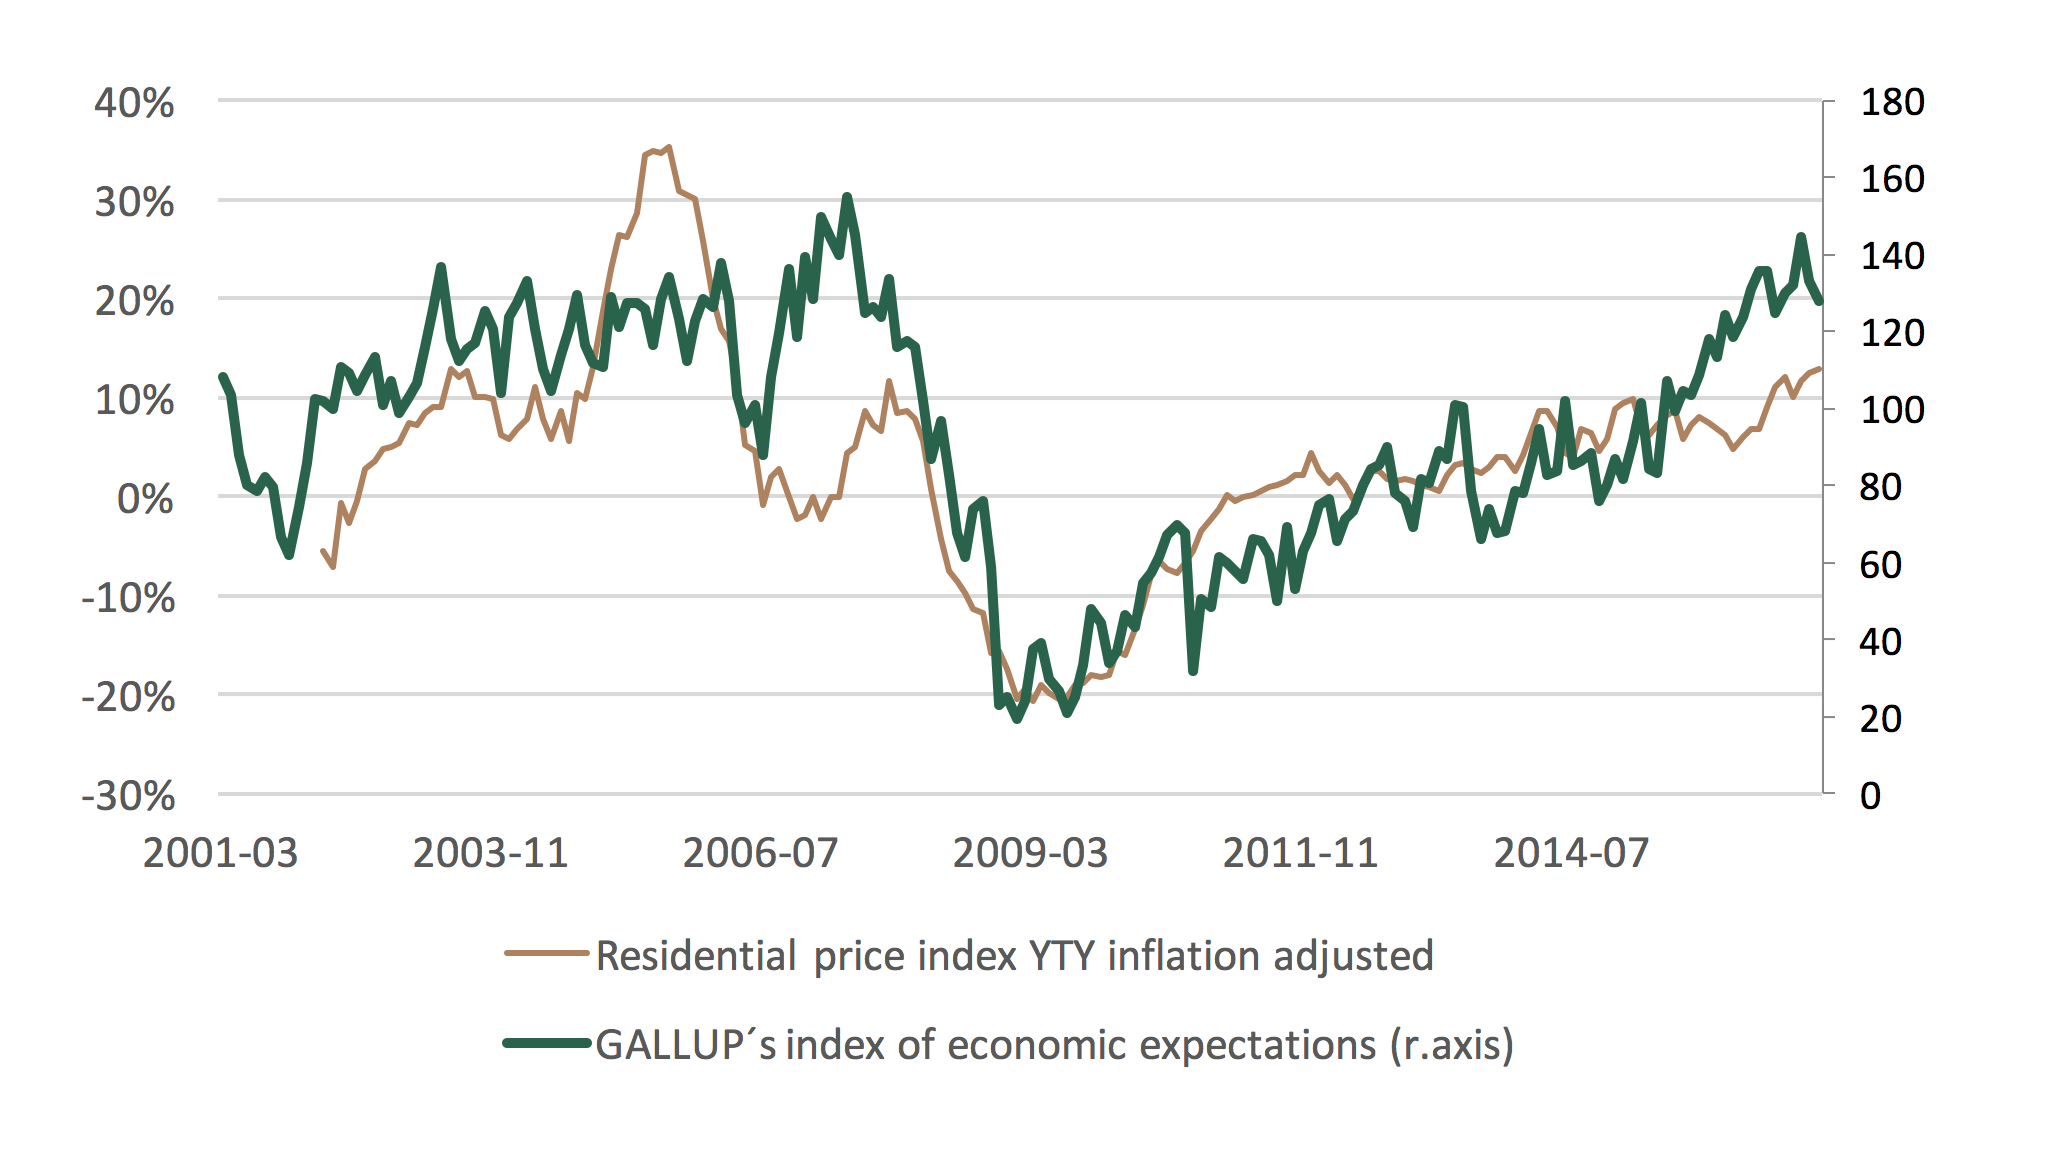
Source: Gallup, Registers Iceland
The increase in tourism combined with an influx of foreign workers has also had a significant impact on rental prices. Consequently, gentrification in downtown Reykjavík has improved. The price of small and midsize apartments in the downtown area have been particularly affected by this. However, in 2016 suburban neighborhoods performed equally well and better on YTY basis (see diagram 5 and 6). An indication of what to come.
Diagram 5
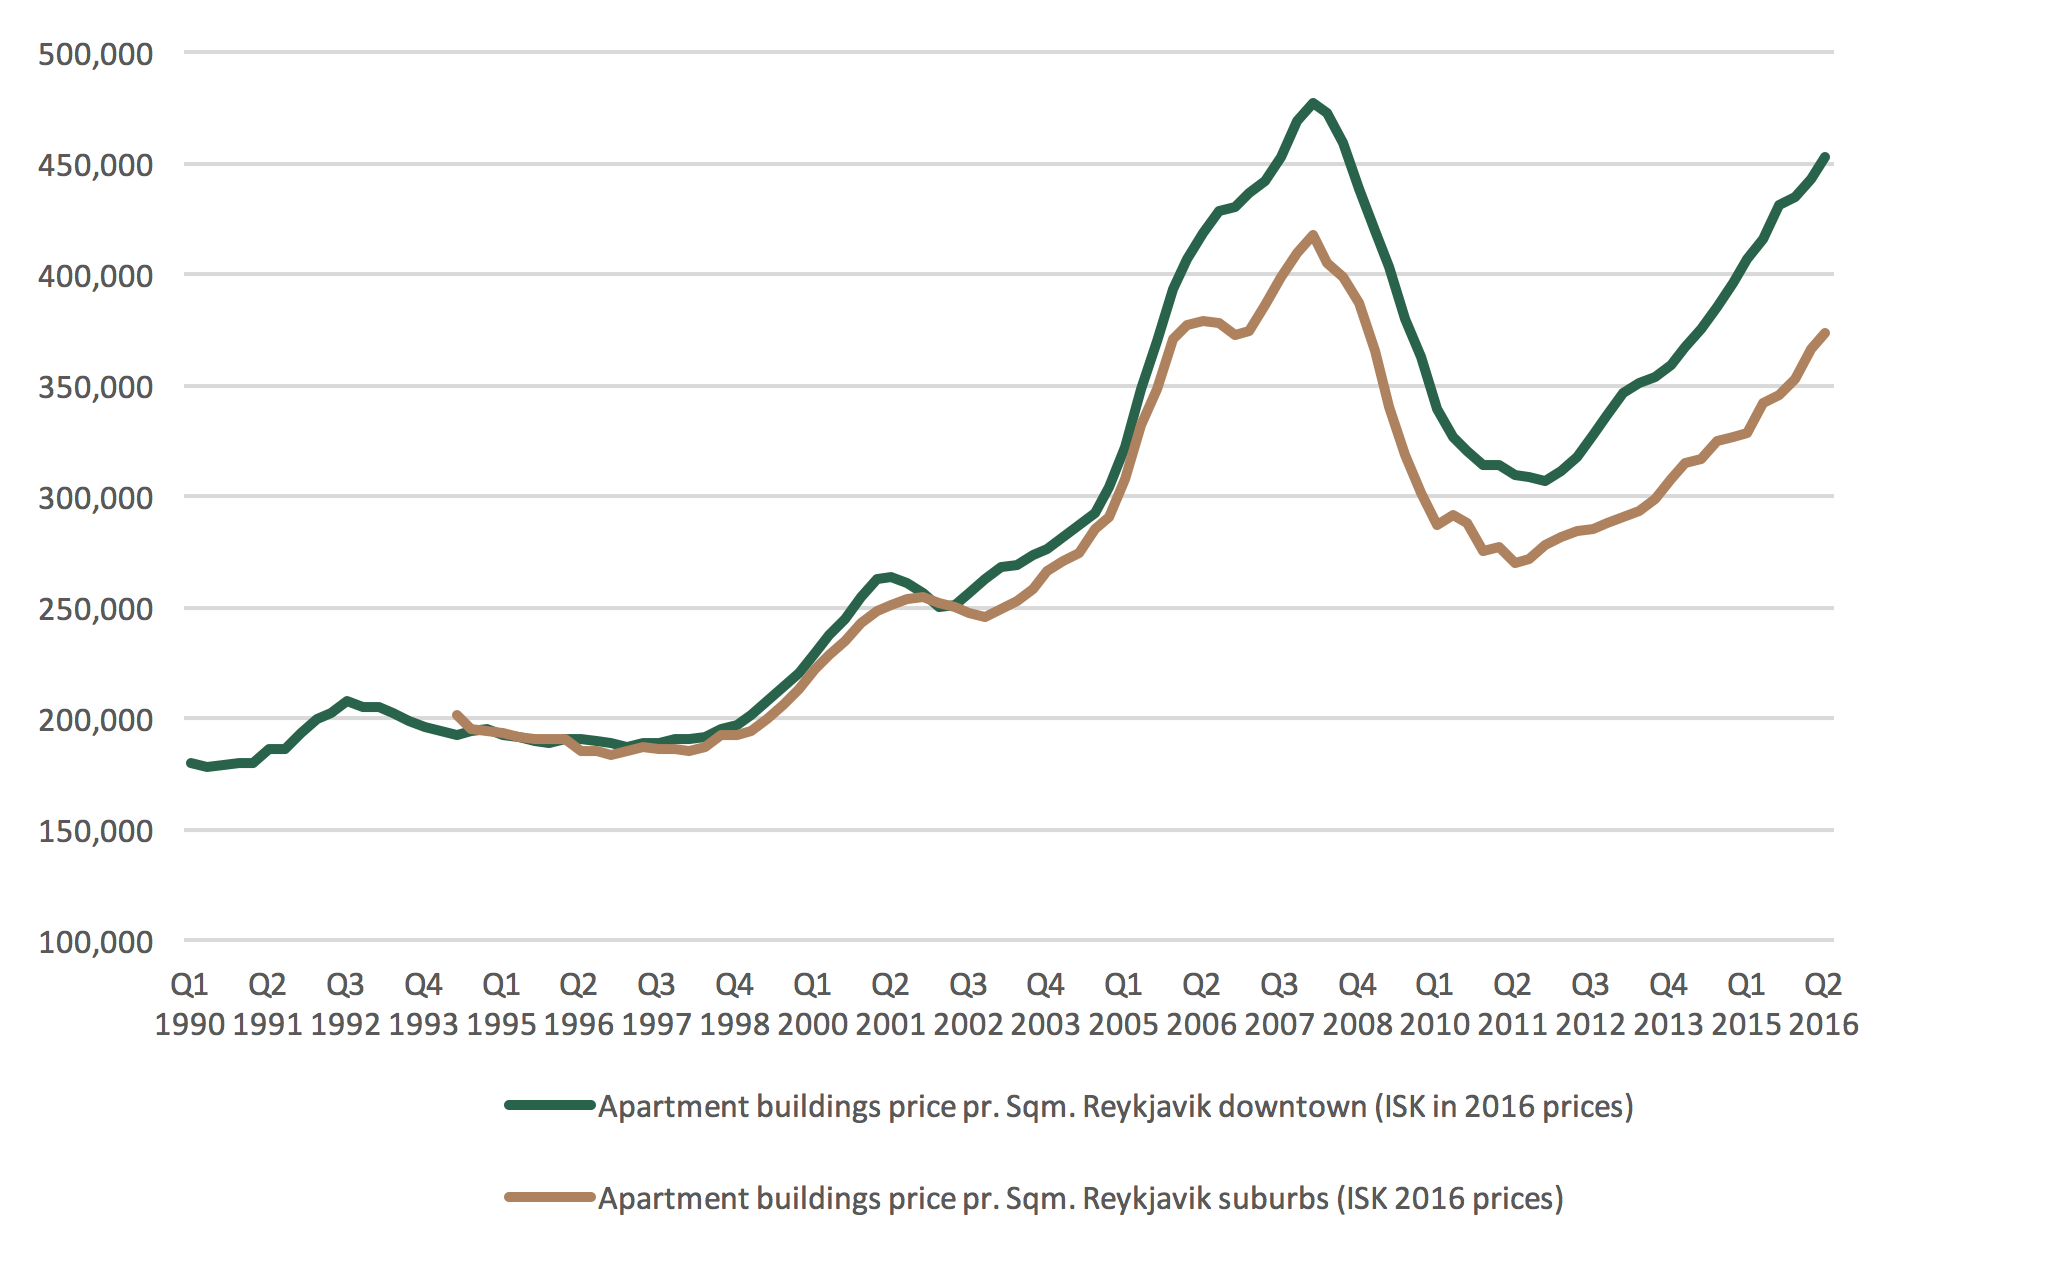
Source: Registers Iceland
Diagram 6
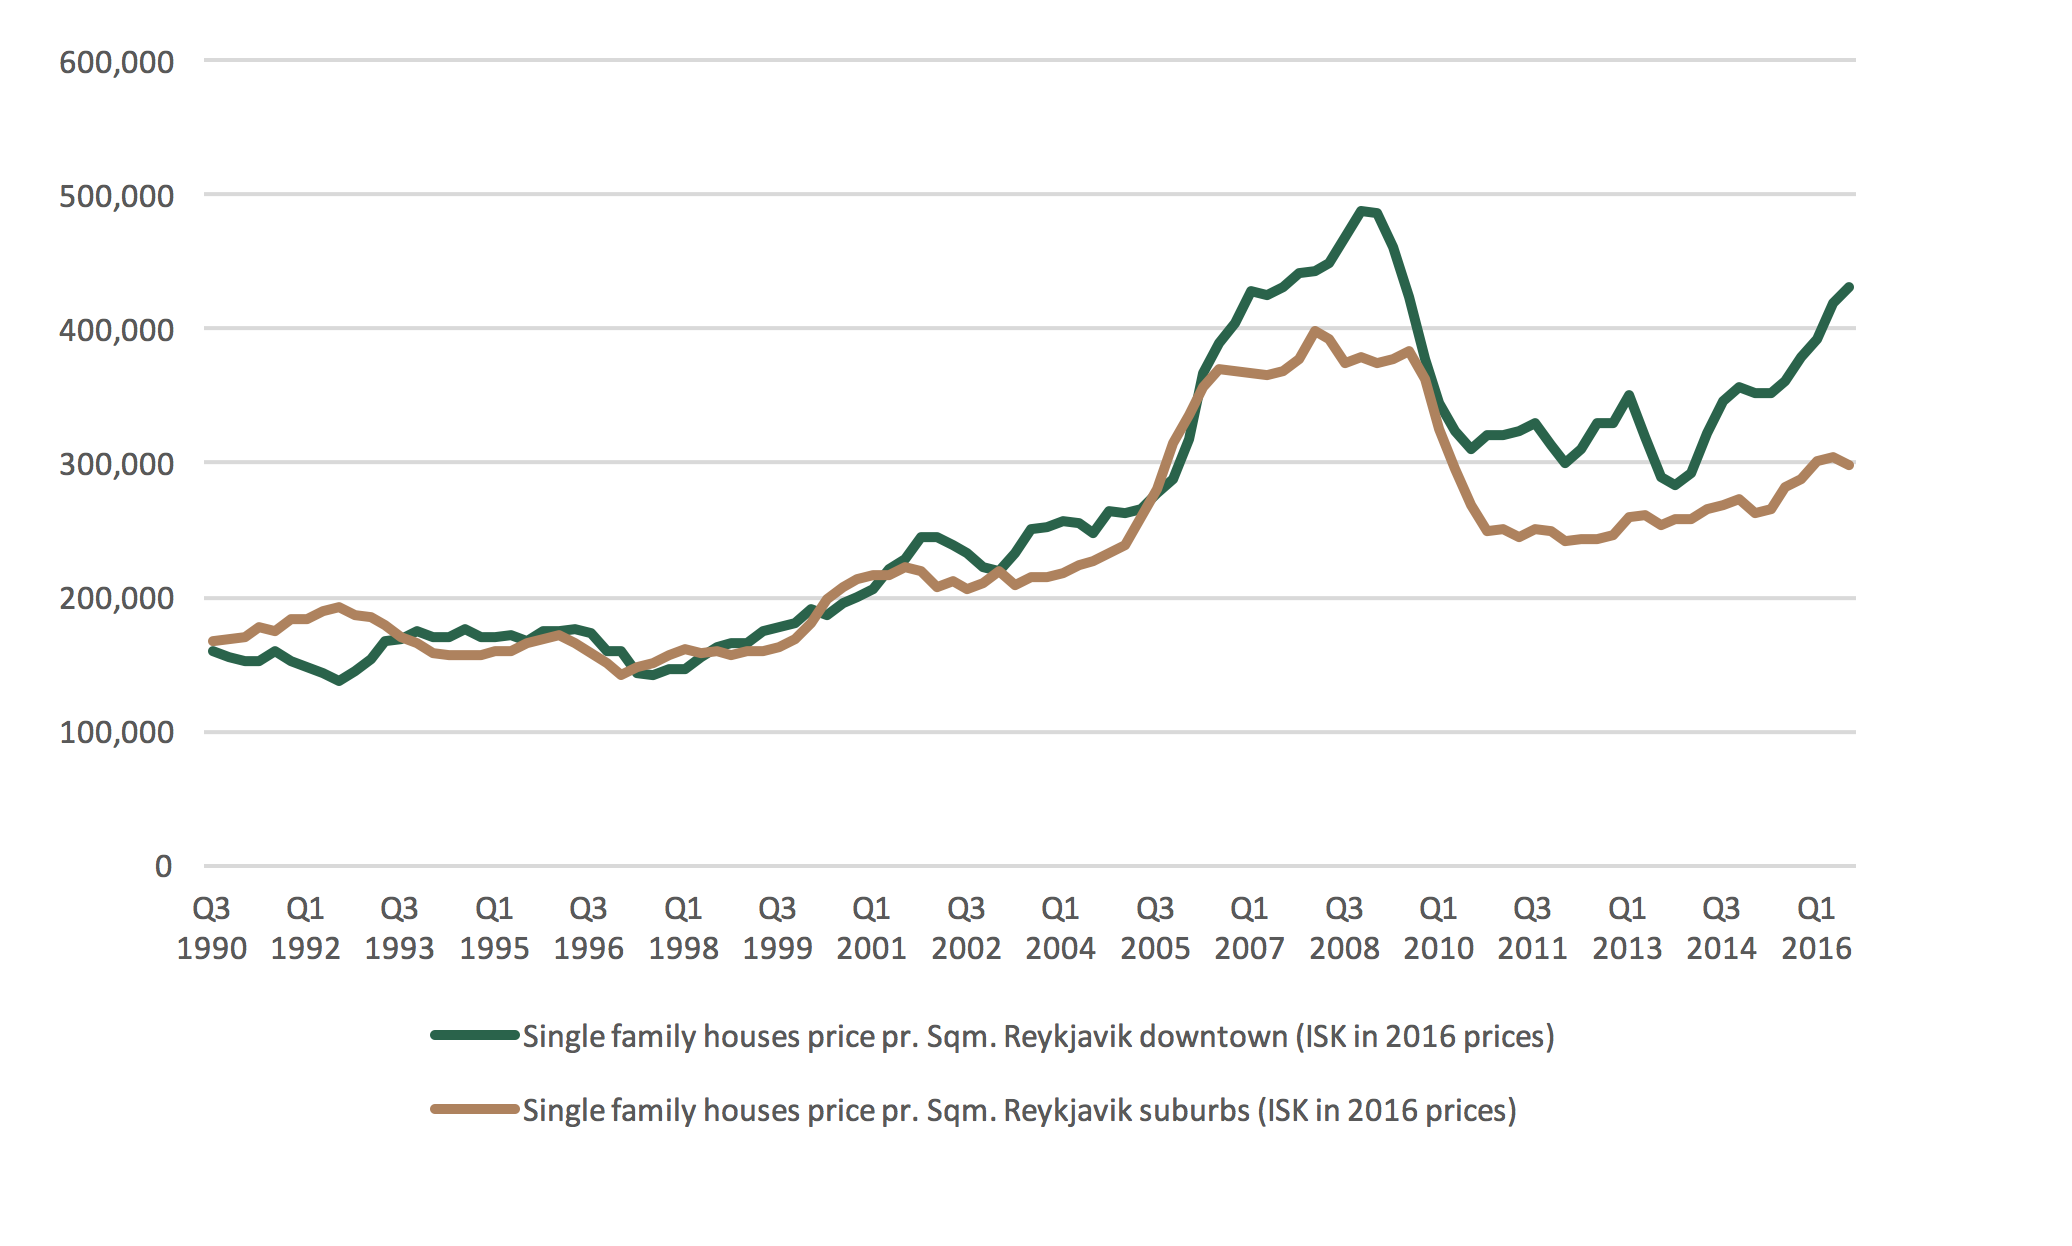
Source: Registers Iceland
When combined, these factors have translated into the biggest increase in housing demand since 2007 with the number of notarized contracts reaching record heights (see diagram 7). The stock on sale, residential and commercial, is decreasing rapidly, i.e., contractors are not keeping up with the market and sales turnaround time is decreasing. The number of housing units on the market have reached a historical low (see diagram 8).
Diagram 7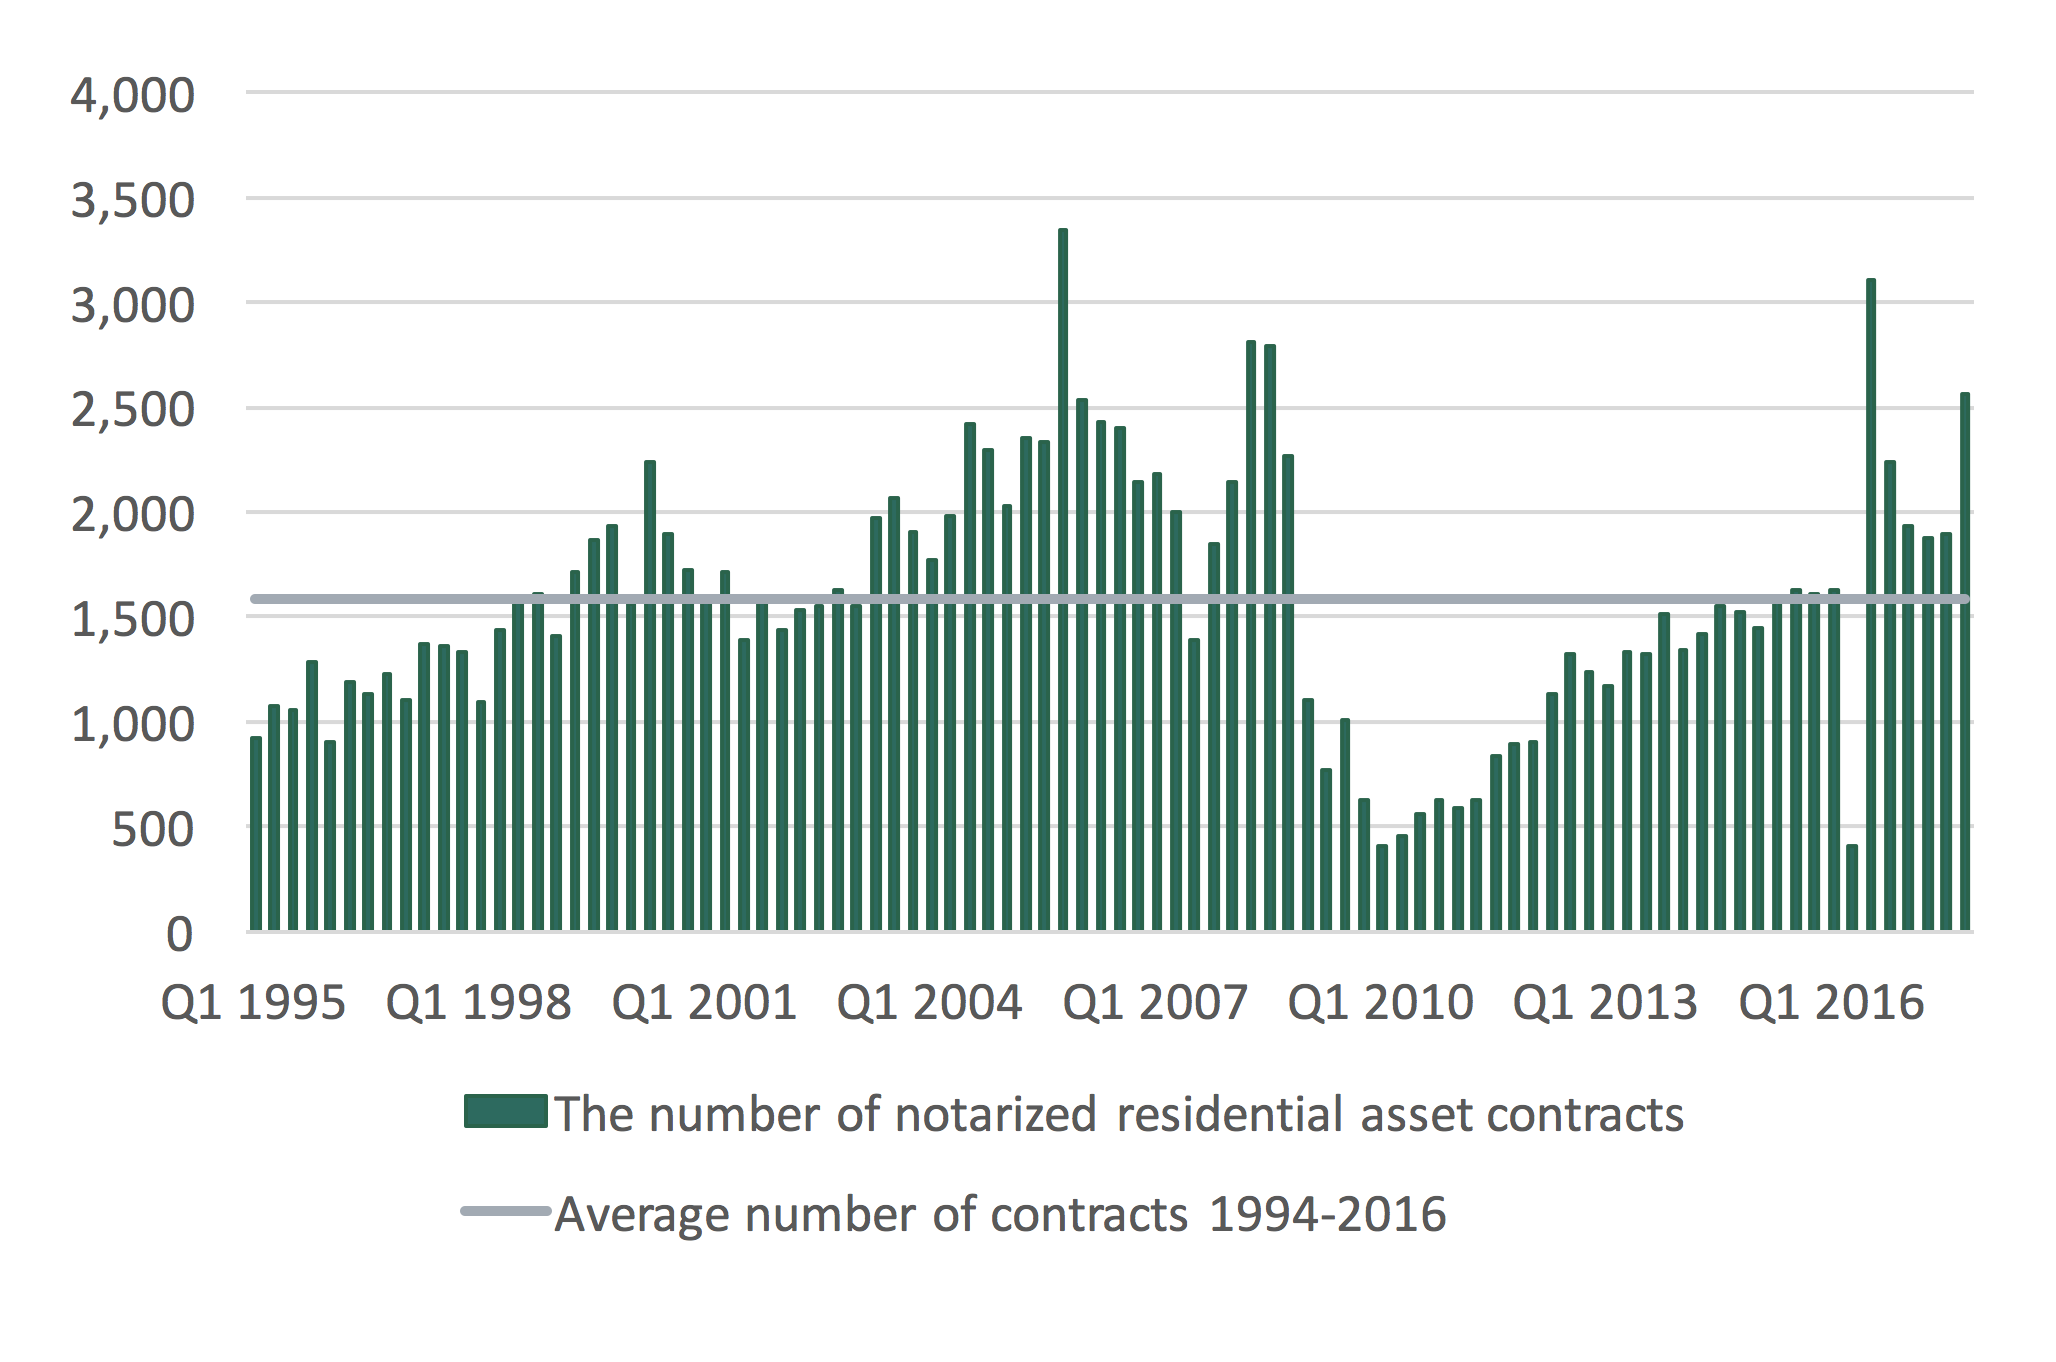
Source: Registers Iceland
Diagram 8 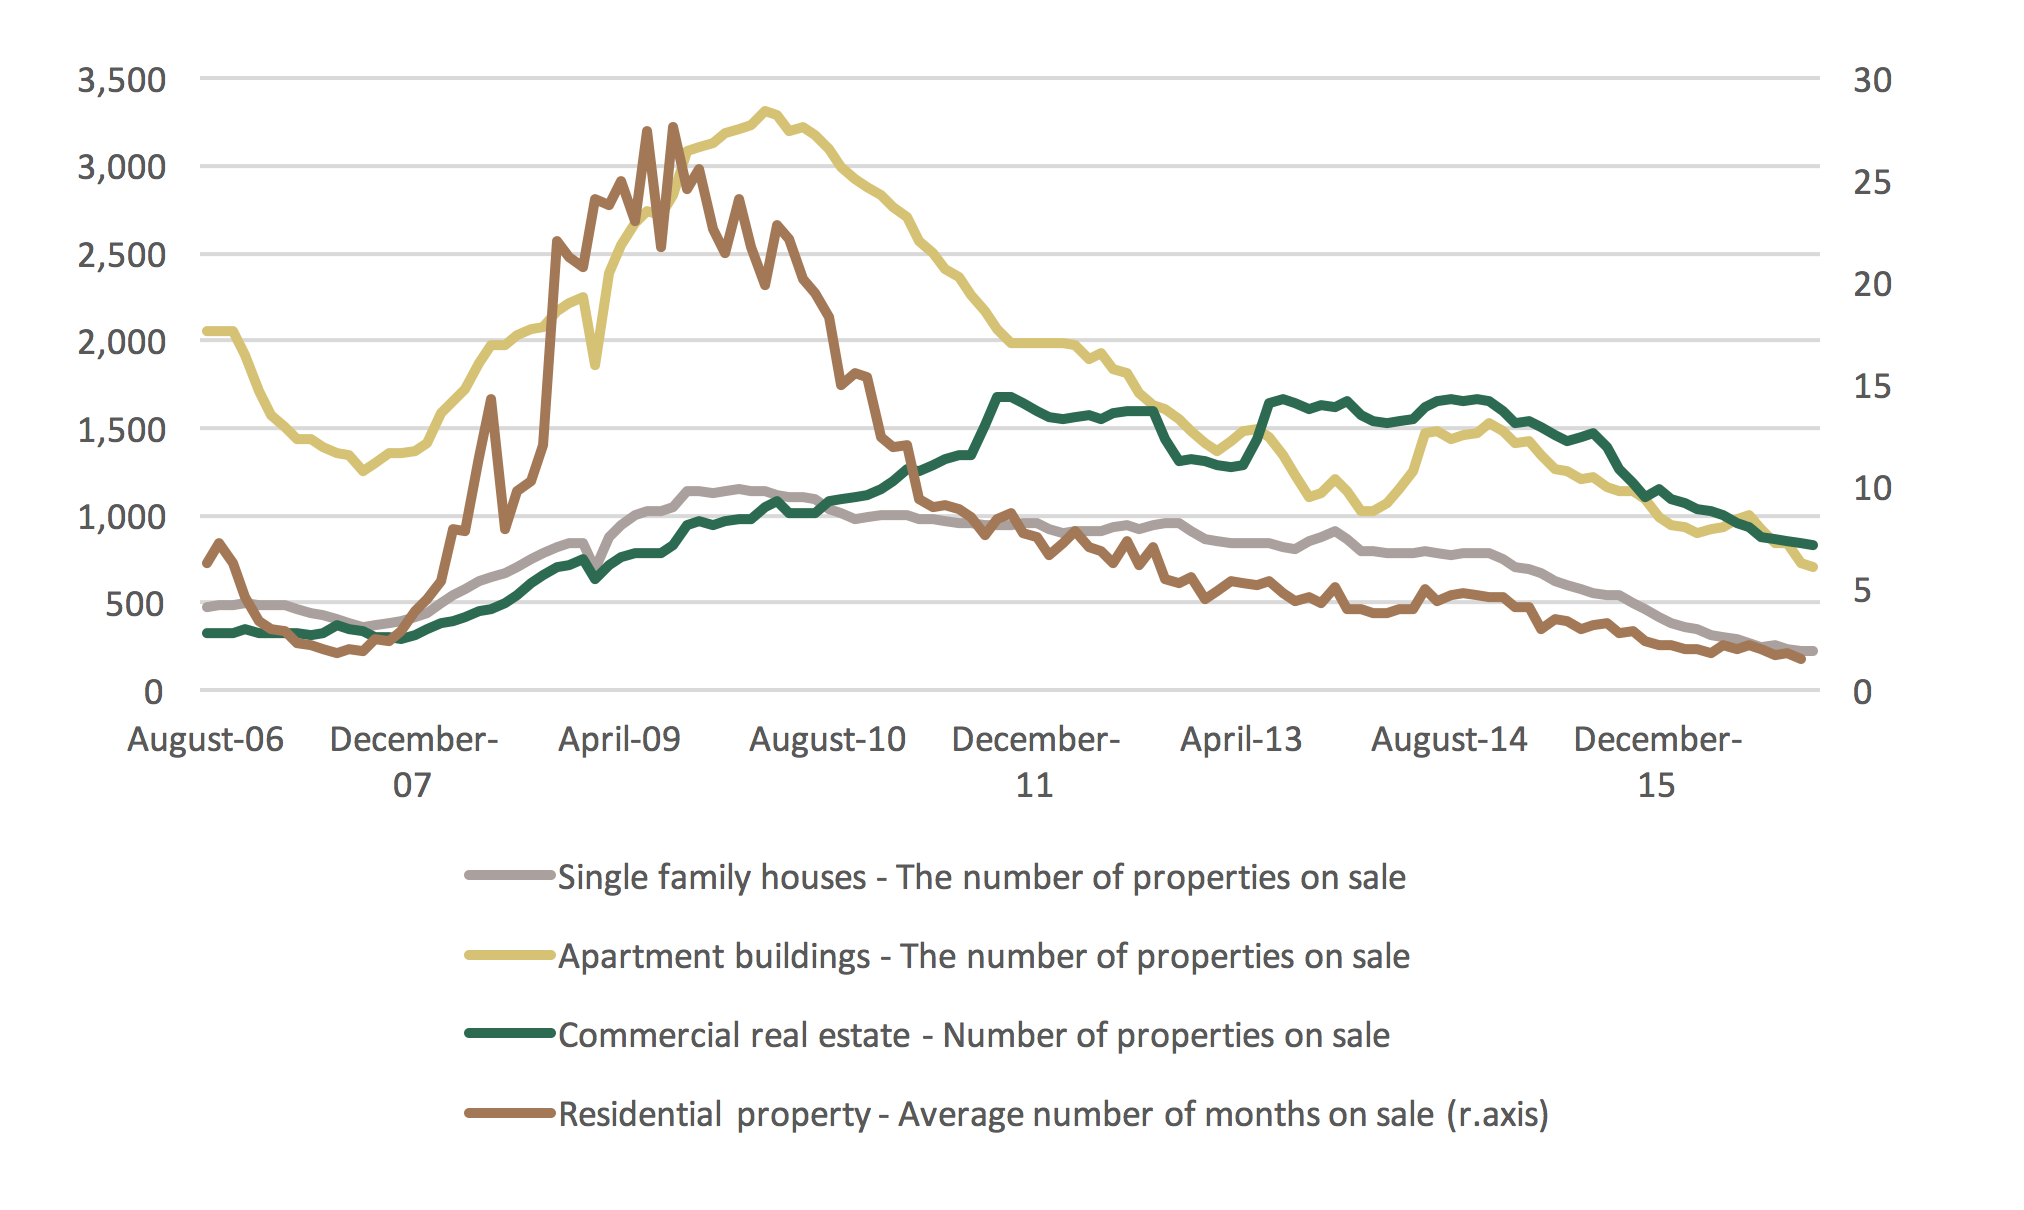
Source: Central Bank of Iceland
Supply is nowhere enough
Last but not least, the supply side has been slow to respond, with many contractors focusing on other markets such as new hotels. Also, zoning by municipalities is limited leading to too little supply of building plots. In 2016, 1,100 – 1,200 new housing units came on the market (see diagram 9); a number nowhere near enough to meet the existing and accumulated demand of at least 5,000 – 7,000 housing units to say nothing of the extra demand due to tourism and foreign workers.
Diagram 9
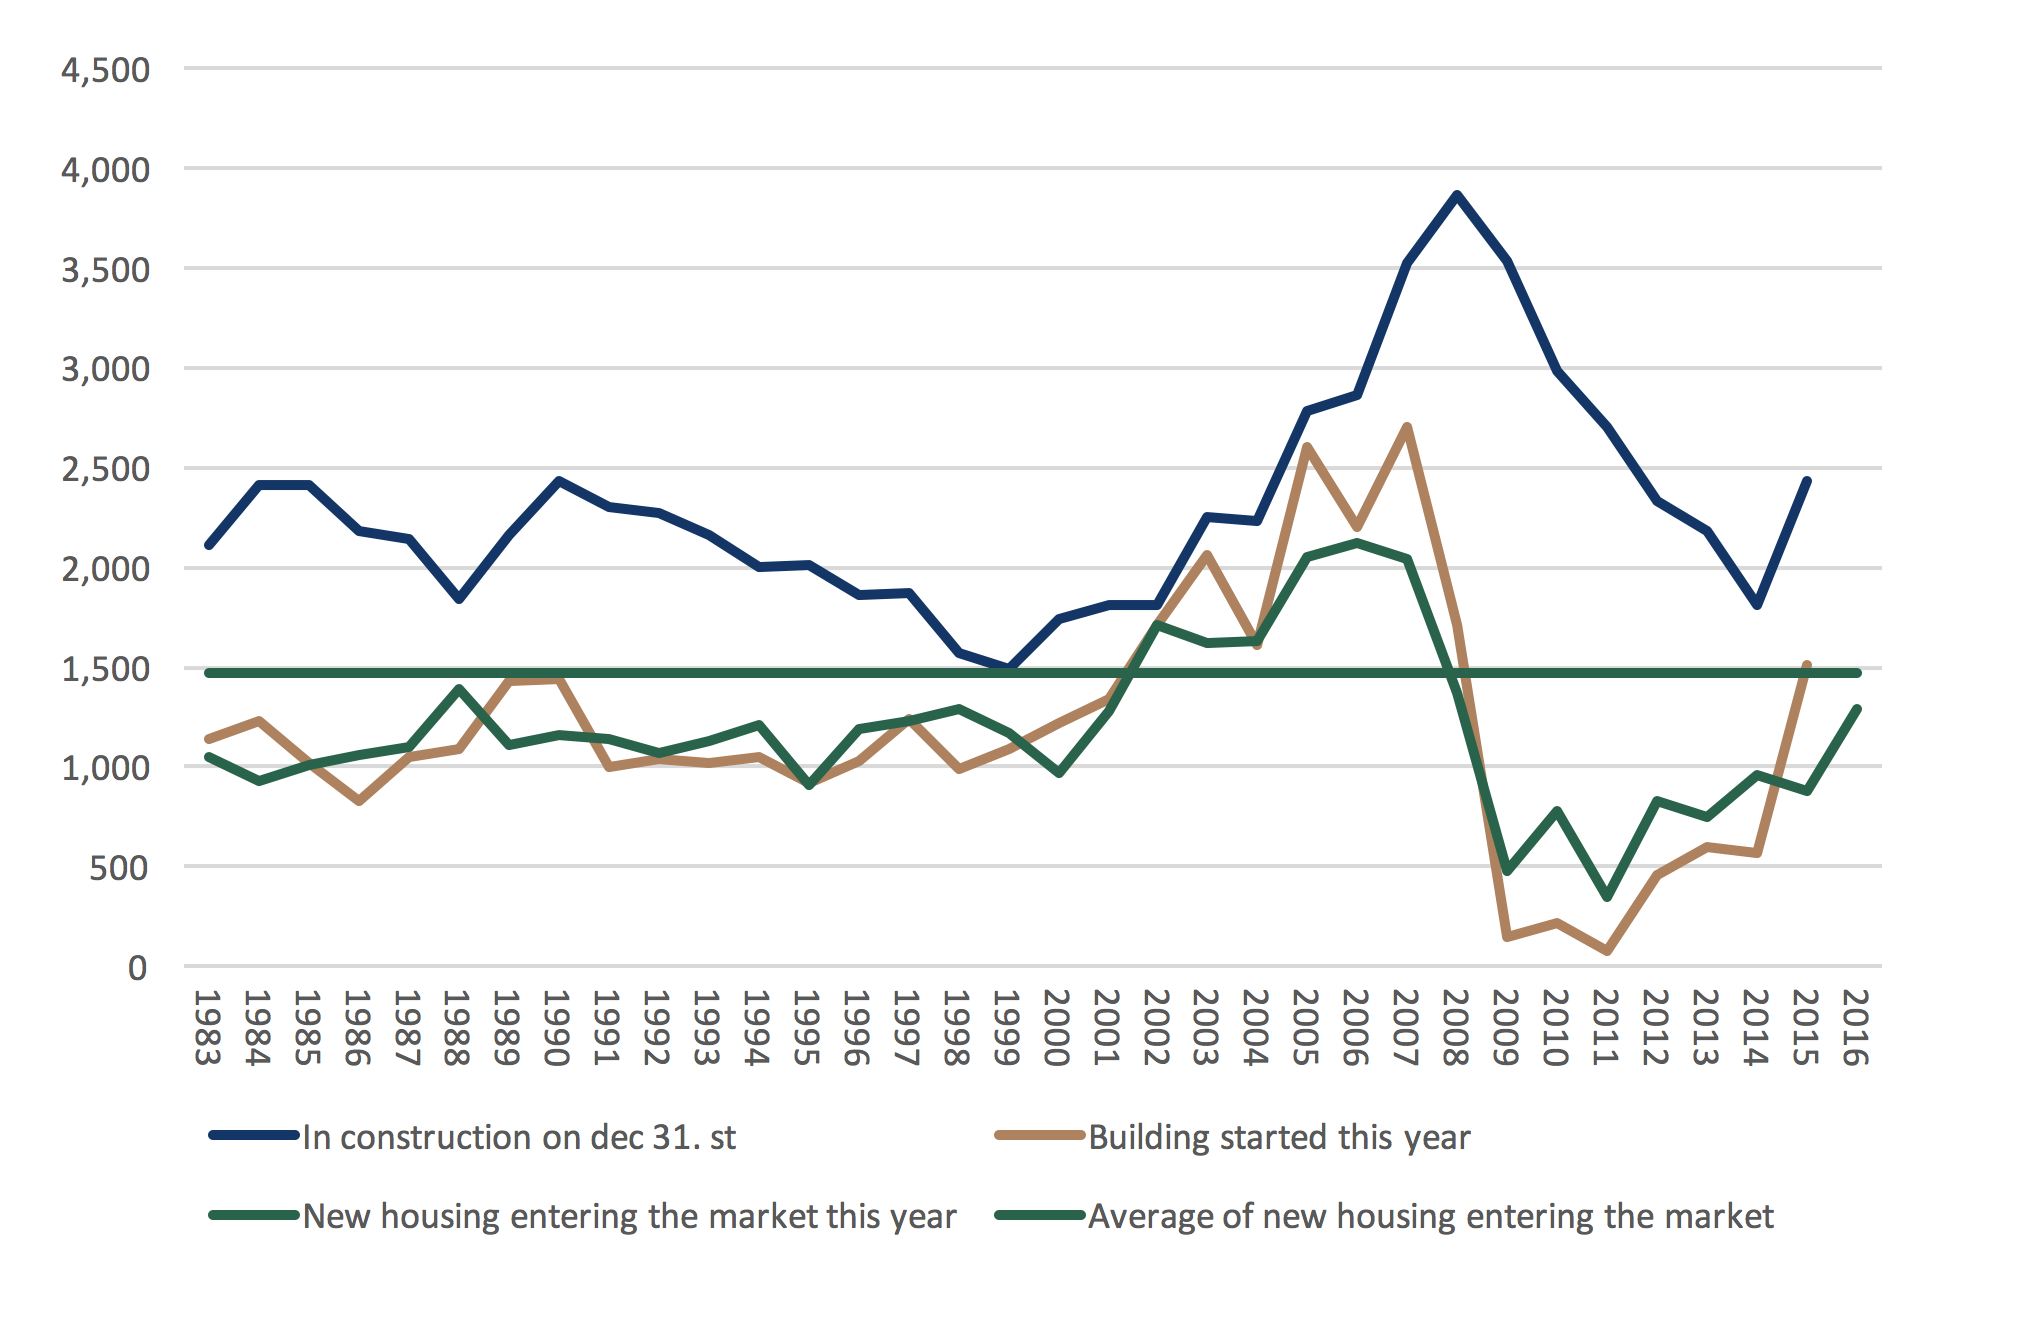
Source: Iceland statistics
Positive outlook for 2017
Demand will remain strong due to positive demographics, increase in tourism, in-flux of foreign workers and improved expectations, given the current economic climate.
Supply is expected to pick up in 2017 with investment in residential property standing at 23.8% of GDP compared to 17.8% in 2016. About 1,500-1,600 new housing units are likely to hit the market in 2017. Those units will not nearly satisfy the accumulated existing demand of 5,000 housing units.
GDP growth is predicted to reach 5.3% in 2017 with aggregate demand growing at 5.8%. According to the CBI household purchasing power will grow by 6.7% in 2017.
Inflation is predicted to remain below 2%.
Cost of borrowing is at an all-time low with an abundant supply of credit (although credit evaluation is stricter than before). The CBI is predicted to lower the policy rate by 50 points in 2017.
First-time buyers will be entitled to tax discount by using a part of their pension savings to buy their first property.
ISK exchange rate is predicted to appreciate by 10% in 2017, which is probably neutral for housing prices.
Reykjavik rental marked has grown substantially, which will support housing prices in the long-run.
Risk factors in 2017
The housing market is facing two distinct risk factors: (i) a domestic shock, with a price increase in excess of what fundamentals warrant, causing inflation and a consequent tightening of monetary policy from the CBI, leading to less supply of credit etc; or alternatively (ii) a sudden external demand shock (e.g. due to deceleration in tourist arrivals), with a consequent collapse in expectations and less supply of credit.
The cost of borrowing has been on a downward trajectory, a trend that is expected to continue this year. In the current environment of scarce supply and rising demand, an easing of the credit evaluation or LTV rules would be a game changer having a direct effect on asset value causing a credit bubble.
Indicators to watch in the coming months include the price to wages (see diagram 11), rent ratios (see diagram 10) which have been trending upwards. A further increase could signal an unsustainable trajectory in the medium to long-run.
Diagram 10
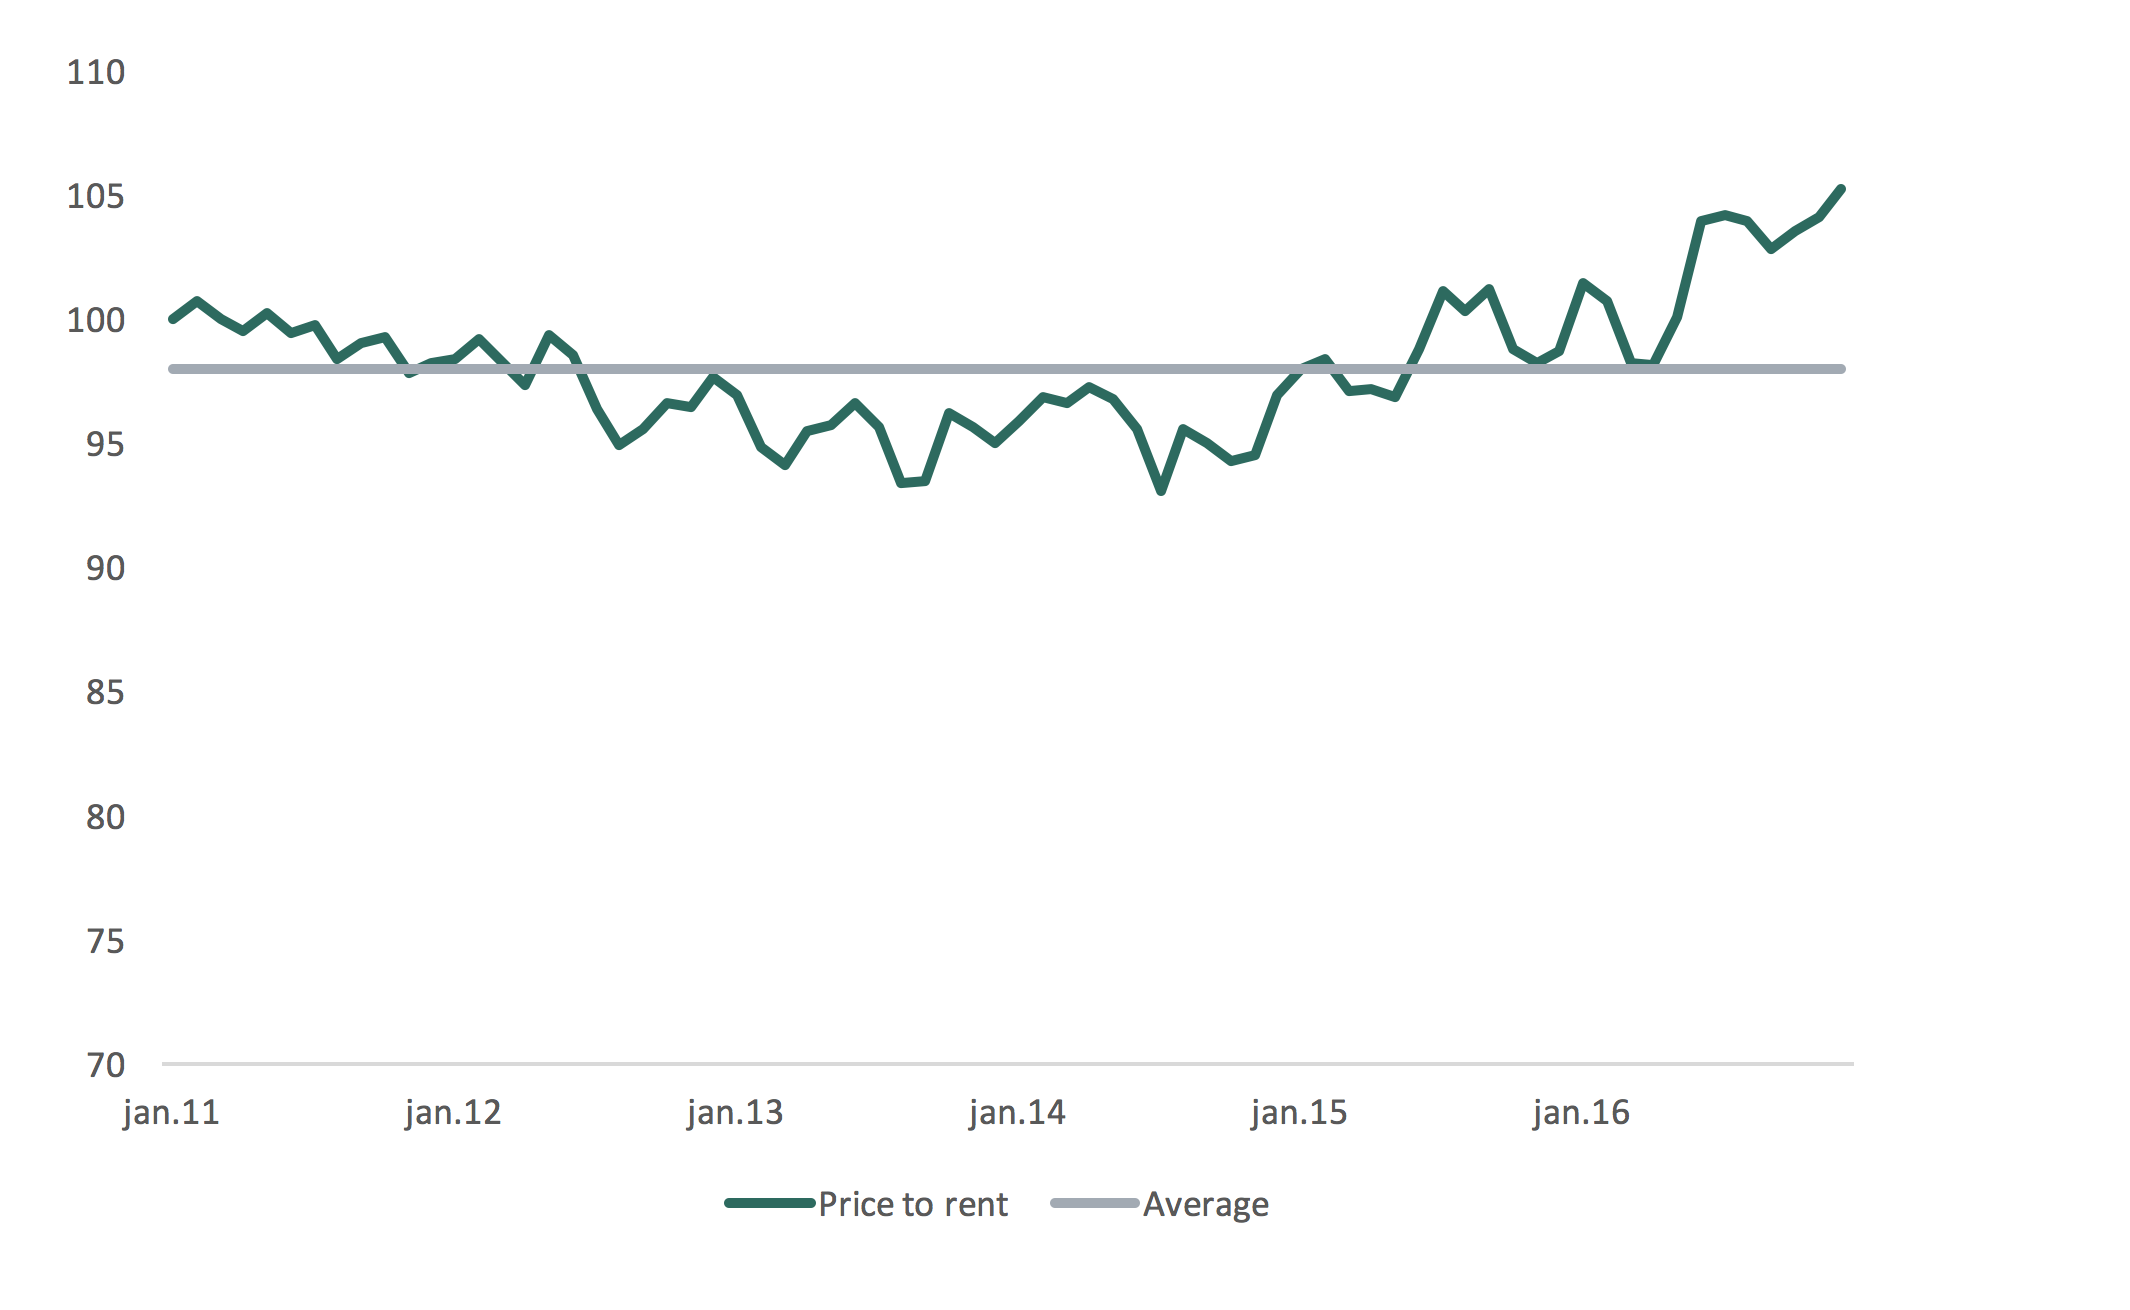
Source: Registers Iceland, Iceland Statistics
Diagram 11
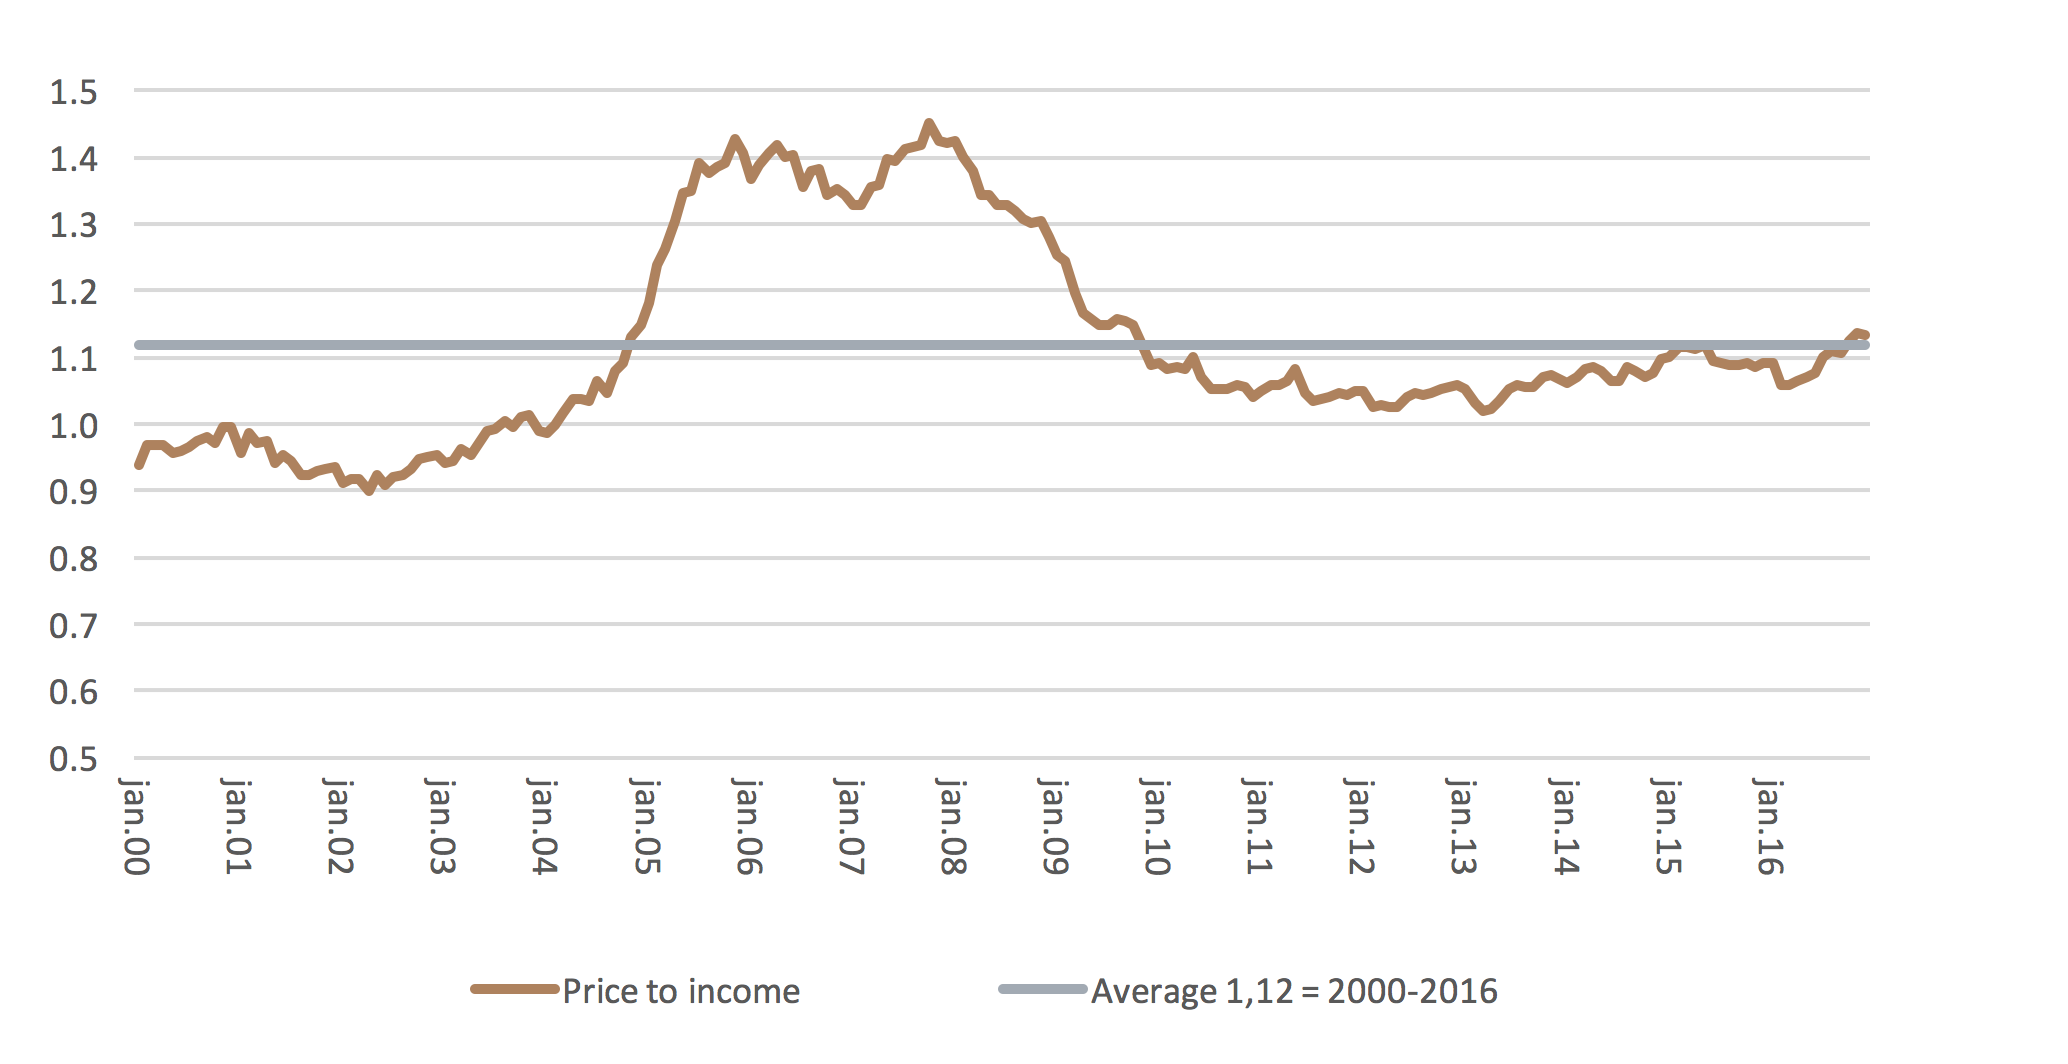 Source: Registers Iceland, Iceland Statistics
Diagram 12
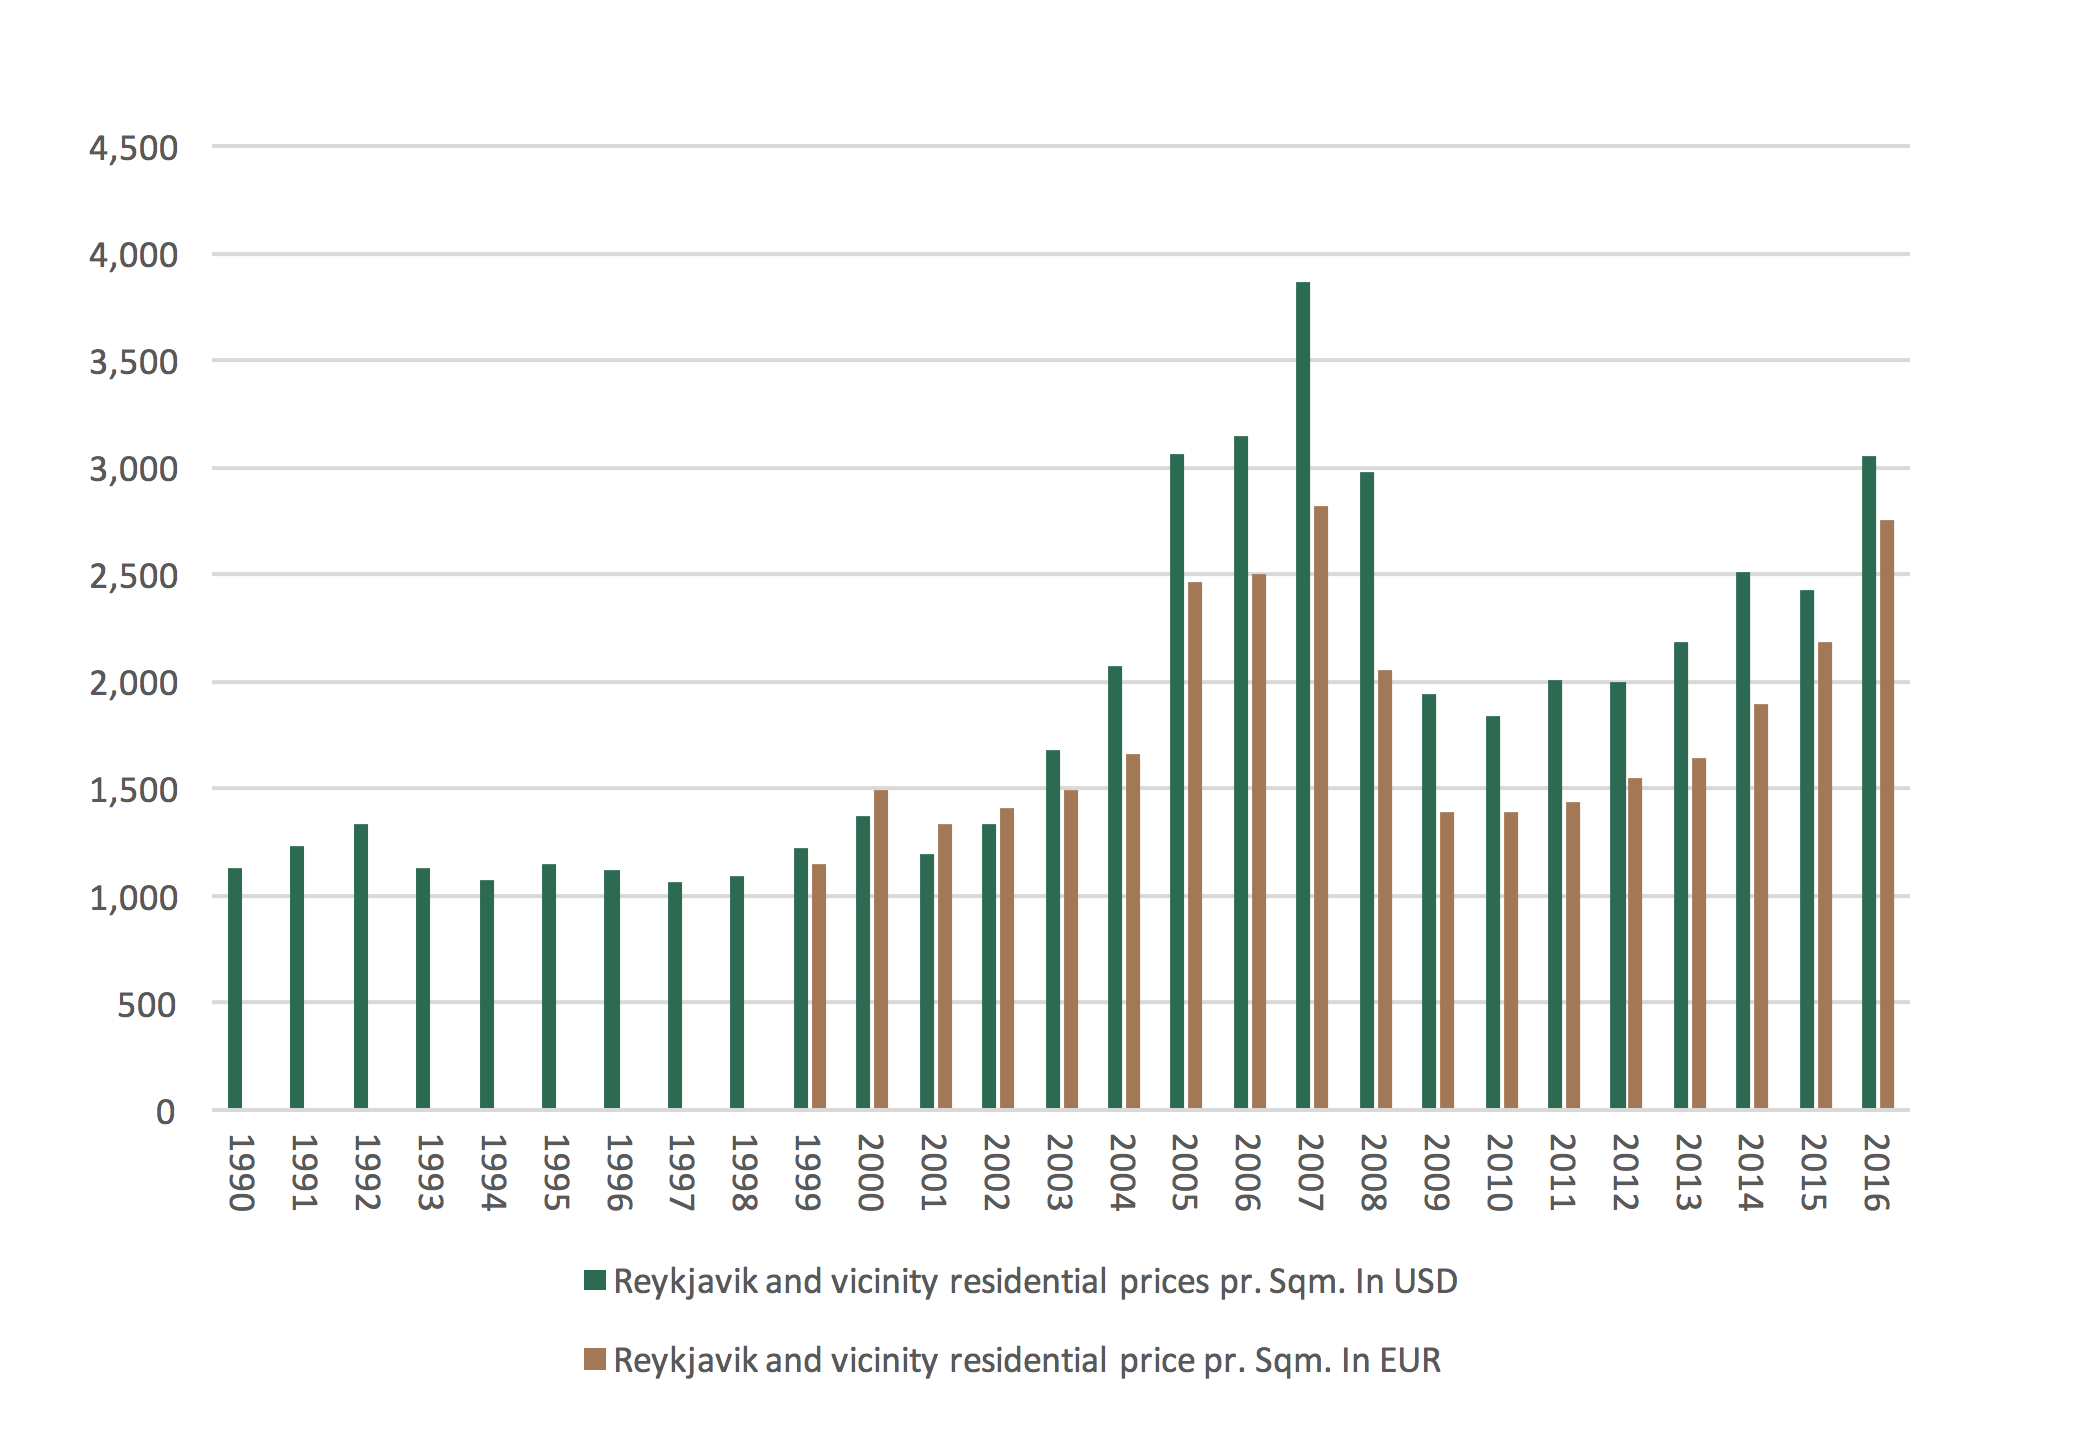
Source: Registers Iceland, Central Bank of Iceland
Disclaimer: The information provided herein is for information purposes only and does not constitute investment advice. It is not intended to provide, and should not be relied upon for, accounting, legal or tax advice or investment recommendations. This document is not intended for further distribution. It does not constitute investment advice in any form and shall not be regarded as a proposal for investment in funds managed by GAMMA. The information presented herein (the Information) is based on sources which GAMMA Capital Management hf. regards as dependable. GAMMA Capital Management hf. has given due care and attention to the preparation of the information, but can nevertheless not guarantee the accuracy or completeness of the information. GAMMA Capital Management hf. is not obliged to make amendments or changes to this publication should errors be discovered or opinions or information change. Special attention should be given to the fact that projections can vary in both positive and negative ways and are subject to uncertainty and contingencies, many of which are outside of the control of GAMMA Capital Management hf. The Information shall not be interpreted as advice to customers on the purchase or sale of specific financial instruments. GAMMA Capital Management hf. bears no responsibility in any instance for loss which may result from reliance on the Information. Neither GAMMA Capital Management hf. nor its personnel can be held responsible for transactions based on the Information and opinions expressed in this presentation. Transactions with financial instruments by their very nature involve high risk. Historical price changes are not necessarily an indication of future price trends. GAMMA Capital Management Limited in London is authorised and regulated by the Financial Conduct Authority in the UK. GAMMA Capital Management HF in Iceland is authorised and regulated by the Icelandic Financial Supervisory.